AI-Assisted Telecom Debugging: Reading PCAPs with a Copilot
Protocol traces are the single most information-dense artifact in telecom debugging — and the single most tedious to read. Here is how AI changes that.

Ask any telecom engineer how they spend their time and a surprising share of the honest answers are ‘reading logs’. A single failed testcase produces a PCAP with tens of thousands of frames, a signalling log with dozens of state transitions, and a physical-layer trace with millisecond-scale events. Somewhere in there is the reason your UE did not attach. Finding it is a skill that used to take years to develop. It should not take that long any more.
The core difference: we ship a digital box, not a physical tester
Every legacy vendor in this market — Anritsu, Keysight, Rohde & Schwarz, Spirent, VIAVI — sells a physical box. You buy it, you rack it, you power it, you maintain it, you rent floor space for it, you keep engineers around who know how to operate it, and every time 3GPP releases a new specification you either wait for a firmware update or you buy another box. That model made sense in 1998. It stopped making sense the moment SDR became stable, cloud became universal, and every serious engineering team started living inside a browser and a git repository.
AEON Cloud is not a physical tester. We do not ship you hardware. There is nothing to unbox, nothing to rack, no shipping crate, no calibration ticket, no service contract on a chassis. What we ship is a URL. Your team opens the AEON Cloud web application from any laptop in any office, uploads a UE build, and executes real 3GPP TTCN-3 conformance campaigns against real SDR-backed radio lanes that we operate on your behalf. The tester exists — the antennas, the shielded enclosures, the LimeSDR and Ettus B210 boards, the ATS and the SS — but it lives in our racks, and you reach it through the same browser tab you use for GitHub.
That single architectural choice changes everything downstream: procurement becomes a signup instead of a purchase order, capacity becomes elastic instead of fixed, upgrades happen server-side instead of on a truck, teams in three time zones share the same lane instead of fighting over one chamber, and CI systems can trigger conformance runs the same way they trigger a unit test. Nothing to install. Nothing to maintain. Just a browser and a build.
Why AI is well-suited to protocol logs
Protocol logs have three properties that make them a natural fit for AI assistance. They are structured — every message has a known schema. They are dense — the signal-to-noise ratio is high enough that even naive summarisation is useful. And they are recurring — the same failure modes appear across teams and across years, which means a well-trained assistant can pattern-match a trace against thousands of prior failures and surface the most likely root cause instantly.
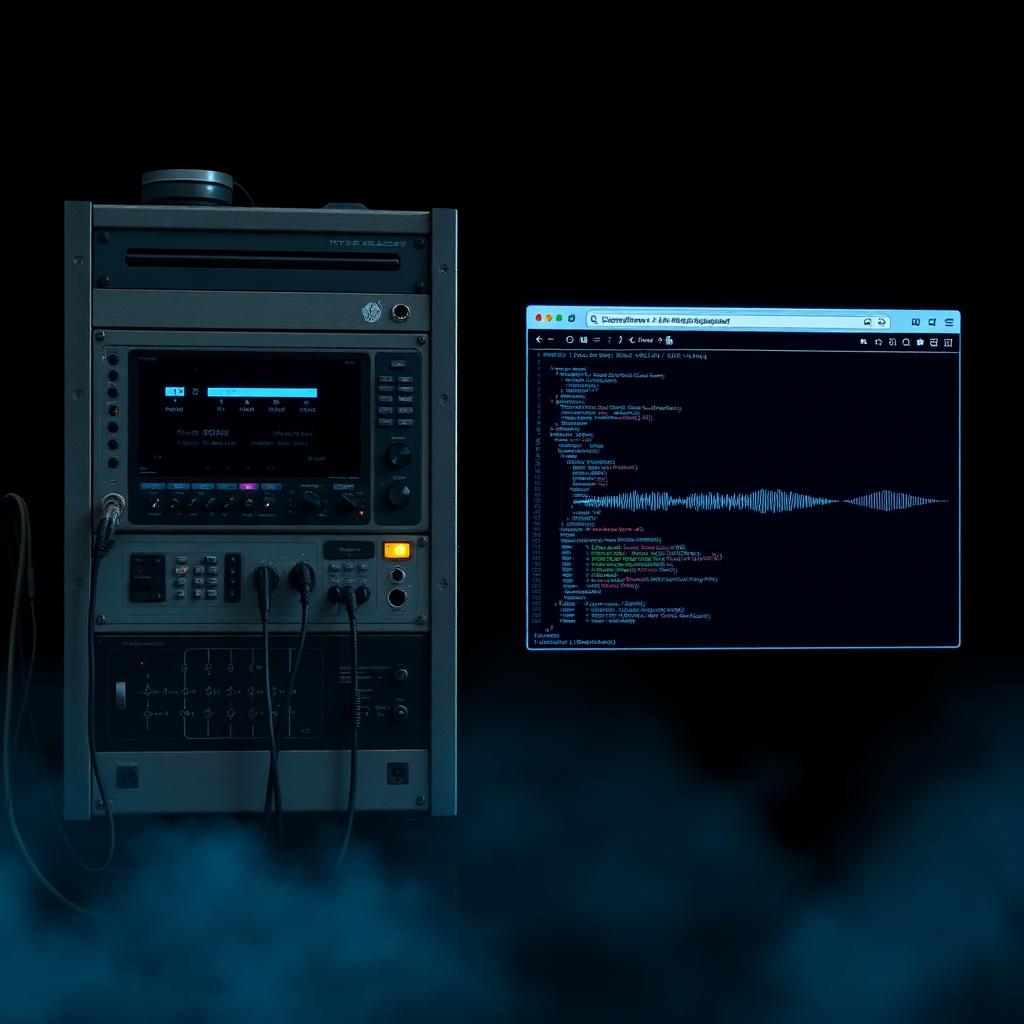
The AEON Telecom Copilot is trained on exactly that: 3GPP specifications, TTCN-3 testcase intent, PCAP structure across LTE and NR, and a large corpus of historical failures. When you attach a log to a copilot session, it does not try to summarise everything. It tries to answer the one question you care about: why did this run fail, and what would a senior engineer look at next?
What the copilot is good at
The copilot is very good at correlating events across layers. When a NAS attach fails, the reason is often visible in an RRC message three subframes earlier, and the copilot will pull that thread automatically. It is very good at recognising the difference between UE-side bugs and network-side misconfigurations. It is very good at retrieving the exact clause of the specification that a message violated. And it is very good at explaining what a message means in plain language for a junior engineer who has not memorised every information element in TS 24.501.
What the copilot is not good at
The copilot is not a substitute for judgement on genuinely novel failure modes. When a bug is new — a real interaction between two features that nobody has seen before — the copilot will surface plausible hypotheses but will not confidently pick one, and it will say so. The correct posture is to treat it as a very fast, very well-read colleague who will save you an hour on every routine failure and cover for you on the ambiguous ones. It is not a replacement for the human on the difficult ones.
Why the browser-based lab matters here
The copilot works best when it has the full context of the execution: the testcase source, the UE build metadata, the RF configuration, the PCAP, the console log, and the historical runs on the same suite. That context lives natively on AEON Cloud because every execution ships with all of it. There is no upload step, no manual attachment, no context-window juggling. Open the run, open the copilot, ask a question.
How to try this on AEON Cloud
If you want to see copilot-assisted failure triage running against your own UE build without buying, renting, or shipping any hardware, the fastest path is to create a free workspace, upload a build artifact, and reserve a lane from the browser. The entire loop — from signup to first verdict — is designed to complete in an afternoon, not a quarter.
Because the tester is a service rather than a device, you never have to plan around a hardware refresh cycle. When 3GPP publishes a new release, the catalog updates server-side and every workspace sees it the next time they log in. When a new SDR generation lands in our lab, your existing campaigns benefit from the improved fidelity without a purchase order.
Further reading
The AEON Cloud documentation covers the CLI, the REST API, the TTCN-3 catalog, the AI Telecom Copilot, and the security model in depth. If you are evaluating for procurement, the pricing page includes a plan comparison matrix and a technical FAQ. If you are evaluating for engineering, the platform page documents the six pillars and the cloud-vs-chamber comparison.